
Hardiness Zones Decoded: How to Use the USDA Map for Smarter Plant Choices
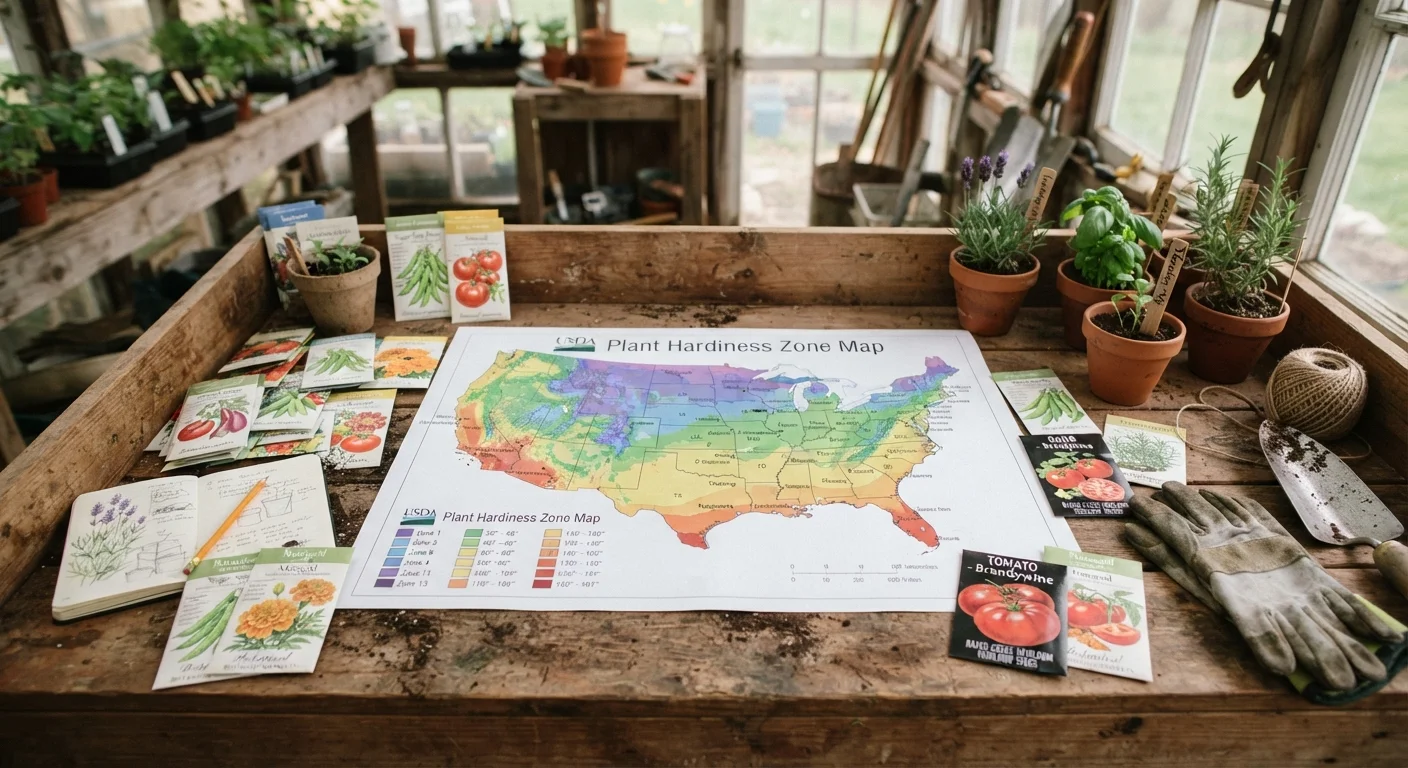
Photo credit: readerspanel.com
In this article
The USDA Plant Hardiness Zone Map is a starting point, not a guarantee. Learn what zones measure, their limits, and how to factor in your microclimate.
What the USDA map actually measures
The USDA Plant Hardiness Zone Map divides the contiguous United States, Alaska, Hawaii, and Puerto Rico into 13 numbered zones. Each zone represents a 10-degree Fahrenheit range of average annual minimum winter temperature. Zone 1 covers the coldest regions, where lows average below -50 degrees F; Zone 13 covers frost-free tropical areas.
The map was most recently updated in 2023, using temperature data collected from 1991 through 2020. That 30-year window smooths out single-year extremes and reflects longer-term climate patterns across the country.
When you see a plant tag labeled "hardy to Zone 6," it means the plant can survive winter lows typical of Zone 6 conditions, which average between -10 and 0 degrees F. That is the only thing the zone rating tells you. It says nothing about heat, humidity, drought, soil, or rainfall.
| Number of zones | 13 (each split into 'a' and 'b' half-zones) (USDA Plant Hardiness Zone Map, 2023) |
| Temperature range per zone | 10 degrees F (USDA Agricultural Research Service) |
| Data period used | 1991 to 2020 (30-year average) (USDA Plant Hardiness Zone Map, 2023) |
| What zones measure | Average annual minimum winter temperature only |
| Heat stress companion resource | AHS Plant Heat Zone Map (American Horticultural Society) |
What zones do not tell you
Zone ratings measure cold survival, not overall suitability. A plant rated hardy to Zone 7 might struggle in a Zone 7 garden because summers there are too humid, too dry, or too hot. The American Horticultural Society publishes a separate Heat Zone Map that tracks the average number of days per year above 86 degrees F, which is the threshold where many plants begin to suffer heat stress. Cross-referencing both maps gives a more complete picture than either one alone.
Soil drainage, wind exposure, and proximity to paved surfaces all affect whether a plant survives winter. A garden bed beside a south-facing brick wall can stay several degrees warmer than an open bed 20 feet away. That difference can shift your effective growing conditions by half a zone or more.
Hardiness zone
A geographic area defined by its average annual minimum winter temperature. The USDA uses these zones to indicate which plants can survive winter cold in a given region.
Microclimate
A small area within a larger climate zone where local conditions (walls, slopes, bodies of water, pavement) create temperatures or moisture levels that differ from the surrounding area.
Heat zone
A classification based on the average number of days per year that temperatures exceed 86 degrees F, the point at which many plants begin to experience heat stress.
Urban heat island
The tendency for densely developed urban areas to be warmer than surrounding rural land, due to heat absorbed and re-radiated by pavement, buildings, and reduced vegetation.
Frost date
The average calendar date of the last spring frost or first fall frost at a given location, used to plan planting and harvest schedules.
Reading your microclimate
Your property almost certainly contains more than one microclimate. Low-lying spots collect cold air on still nights, so frost arrives earlier and lasts longer there than on a gentle slope. Urban lots surrounded by pavement and buildings tend to stay warmer than rural properties in the same zip code, a pattern called the urban heat island effect.
To get a useful read on your conditions, track your own last and first frost dates over several seasons rather than relying only on regional averages. A minimum thermometer placed in different beds across your yard will show you where cold air settles. That data is more useful for plant selection than your zone number alone.
Gardeners near the ocean or large lakes often find their zone ratings misleading in both directions: coastal winters may be milder than the zone suggests, while spring warming may arrive later because of water's thermal mass.
Putting zones to practical use
Use your zone as a filter, not a rulebook. Start by eliminating plants rated for zones significantly colder or warmer than yours. Then evaluate the remaining candidates against your actual site conditions: sun exposure, soil type, moisture, and summer heat.
For borderline plants, placement matters. A Zone 7 shrub planted in a Zone 6b garden may survive if sited against a sheltered south-facing wall with good drainage. The same plant in an exposed northern corner will likely not make it through a hard winter.
Mulching is one of the most reliable ways to extend a plant's cold tolerance. A 2- to 4-inch layer of shredded bark or straw over the root zone insulates soil, moderating temperature swings that damage roots more than cold air alone.
Perennials and woody plants get the most attention in zone discussions, but annuals and vegetables use the map differently. For those crops, the relevant data is your frost date window and the number of frost-free days in your growing season, both of which local cooperative extension offices track and publish for free.
This article provides general gardening education. Plant performance depends on many site-specific factors; consult your local cooperative extension service for recommendations suited to your exact location.

Author
Home & Garden Editorial Team
Home & Garden Editorial Team is the collective byline for our editorial team and contributor network. Articles published under this byline or an editorial pen name are researched, written, and reviewed according to our editorial standards for clarity, consistency, and independence before publication.
View all articles →